Getting started#
Hi there and welcome to the getting started guide of TASI 👋😀 This page
shall help to get started right away with instructions on how to install
TASI and a description of the main TASI concepts. You may visit the
following links one after another. Note that the sections may contain links to
external pages. It is recommended to visit those links before continuing. If you
have any questions regarding TASI, feel free raise an issue. Happy reading
😁
Installation#
An always up-2-date version of TASI is available via the Pypi registry. So, to get started with TASI,
it is just a matter of installing tasi with
pip install tasi
The previous command will install the base version of TASI. Extensions can
be installed via the following extras.
Extra |
Description |
|---|---|
all |
Full version of |
geo |
Models for representing data using GeoObjects |
visualization |
Add visualization capabilities |
wms |
Add additional visualization capabilities of layers from WMS/WFS |
io |
Add the input/output interface based on pydantic and SQLAlchemy |
Basic concepts#
Similar to pandas and geopandas in TASI, we represent traffic data
using a tabular-styled format. To achive this, TASI extends pandas and
geopandas to provide functionality for traffic data analysis. The top-level
model is the Dataset as illustrated in Fig. 1. Every
row in a Dataset contains information for a specific point in time
as attributes. That is, an attribute can be any relevant traffic information,
e.g., the position of a traffic participant or the rain intensity.
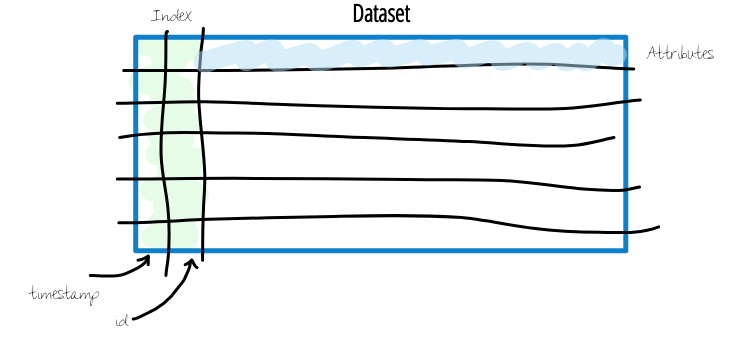
Fig. 1 The top level model for traffic data representation is the
Dataset.#
Most of the time, we will work with information about the traffic participants
that are represented in the Dataset. To make live a little bit
easier, TASI uses a hierarchical view on trajectory data based on the
Dataset as illustrated in Fig. 2. Since a
Dataset typically contains information about multiple traffic
participants, each having a trajectory, the Dataset is a container
for multiple Trajectory. This is denoted with the different id
values and color encoded rows. Furthermore, since a single row is a
representation of a traffic participant’s state in a specific point in time, the
Pose
representation of a traffic participant’s state for a specific point in time is with the class.
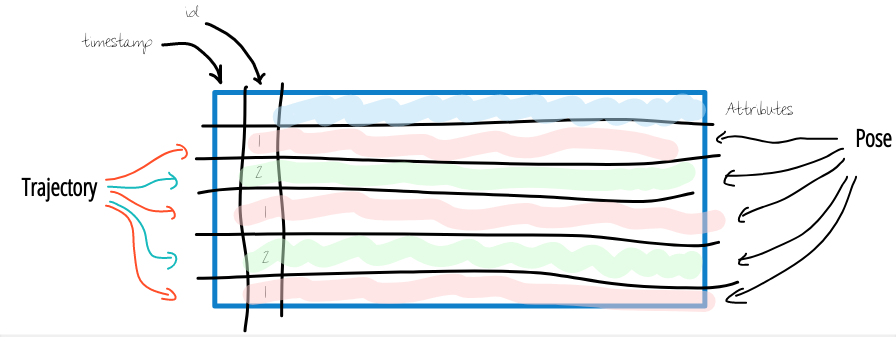
Fig. 2 Hierarchical view on trajectory data.#
Since TASI uses Pandas under the hood, head over to the official pandas
User Guide. Afterwards,
you may head over to the User Guide for some use-case
related examples using TASI. If you want to contribute to TASI, visit
Development Documentation for further instructions.