Note
Visualization of WMS layers#
If we work with trajectory data, we often want to visualize information from a so called birds eye view on some digital layers, such as ortophotos. Typically, those layers are provided by some Web Map Service (WMS). TASI is equipped with classes that allows to query such WMS servers and visualize them.
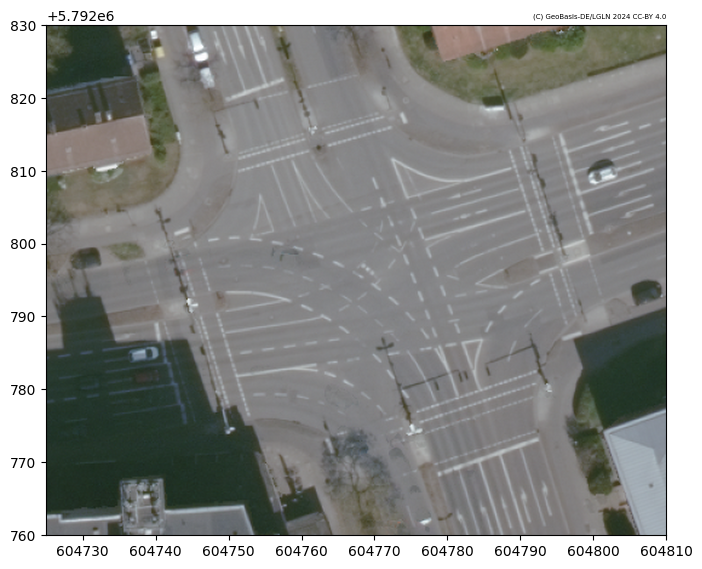
To achieve this, we extend the tilemapbase library to also support other WMS servers than OSM. In the following, we demonstrate how to visualize a orthophoto of the DLR AIM Research intersection where the DLR Urban Traffic Dataset was collected.
Tiles and Plotter#
In tilemapbase, visualization of images provided by a WMS server is managed by two entities, a Tile and a Plotter. The Tile is the interface to the WMS server and, originally, requires a center position and a zoom level since this is the interface by OSM. In TASI a customized version is available that allows to query WMS servers that requires to specify a boundingbox using a 2-point definition (boundingbox tile).
In TASI there is already a custom Tile, the LowerSaxonyOrthophotoTile that provides access to the orthophoto of Lower Saxony which is provided by the Landesamt für Geoinformation und Landesvermessung Niedersachsen.
Since in tilemapbase, the interface to the WMS server requires to specify a position and a zoom level, we have to adapt the original Plotter since it would not work with a boundingbox tile. In TASI, the BoundingboxPlotter is available that is a custom plotter that works with these tiles.
[ ]:
Plotting using Matplotlib#
To visualize a layer from a WMS server, tilemapbase uses matplotlib. Thus, let’s create an Figure and Axes where we want to visualize the layer. Furthermore, we need to specify the extend of the region that we want to visualize.
[1]:
import matplotlib.pyplot as plt
import numpy as np

from tasi.plotting.wms import BoundingboxPlotter, LowerSaxonyOrthophotoTile

f, ax = plt.subplots(figsize=(8, 8))

roi = np.array([604725, 5792760, 604810, 5792830]).reshape(-1, 2)

plotter = BoundingboxPlotter(roi, LowerSaxonyOrthophotoTile())
plotter.plot(ax)
[2025-12-05 13:04:18 | tiles.py:fetch:184] > INFO: Requesting https://opendata.lgln.niedersachsen.de/doorman/noauth/dop_wms?bbox=604725,5792760,604810,5792830&service=WMS&crs=EPSG%3A25832&format=image%2Fpng&request=GetMap&layers=ni_dop20&styles=&version=1.3.0&width=512&height=421
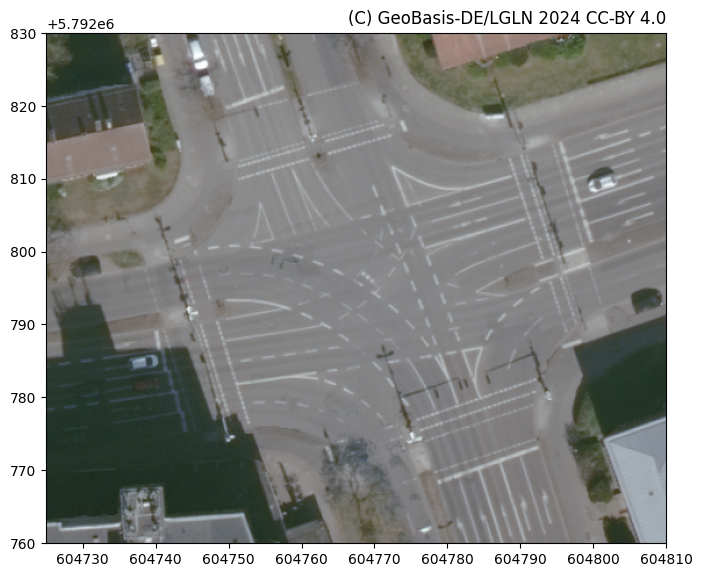
The position of the attribution changes based on the shape of the region of interest, while the font size is fixed. You can change via the attribution_kwargs argument.
[2]:
f, ax = plt.subplots(figsize=(8, 8))

plotter.plot(ax, attribution_kwargs={"fontsize": 12})
That’s it for now but there is more to come. We plan to add several other tile variants that provide access to various WMS servers. If you want to add your own WMS server, have a look into the definition of the LowerSaxonyOrthophotoTile tile. Adding a new Tile is straightforward 😉.